Features · Insights & Reporting
Dashboards
tell you
what
happened.
Iris tells you what will happen
Every question your team has been asked, and every answer you've given, becomes a flywheel. Use each proposal to influence your next win: get smarter. Know more, and win more with every response, instead of starting from zero each time.
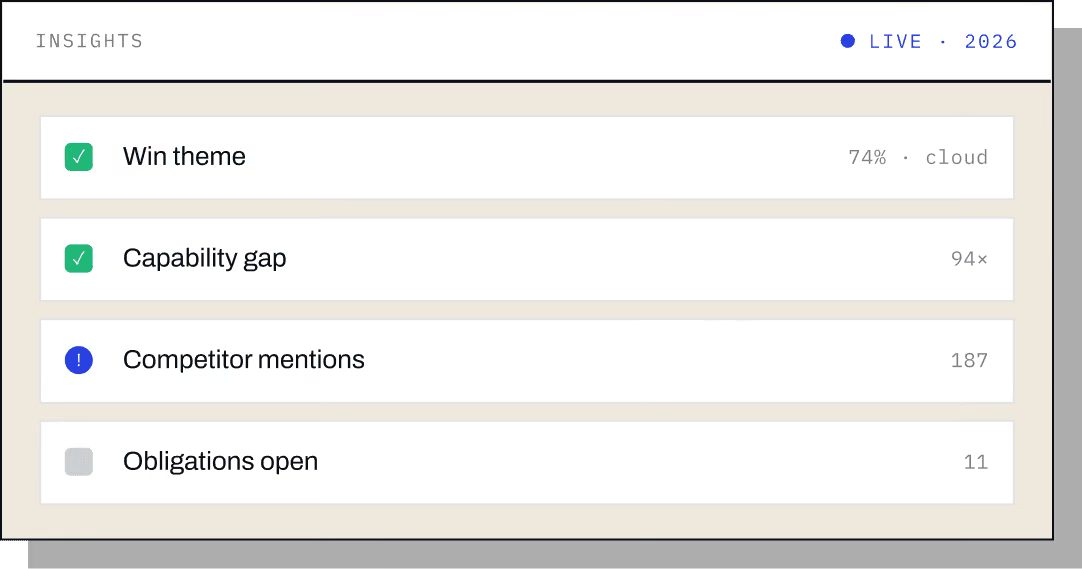
Strategic reporting
Across every RFP you have ever run.
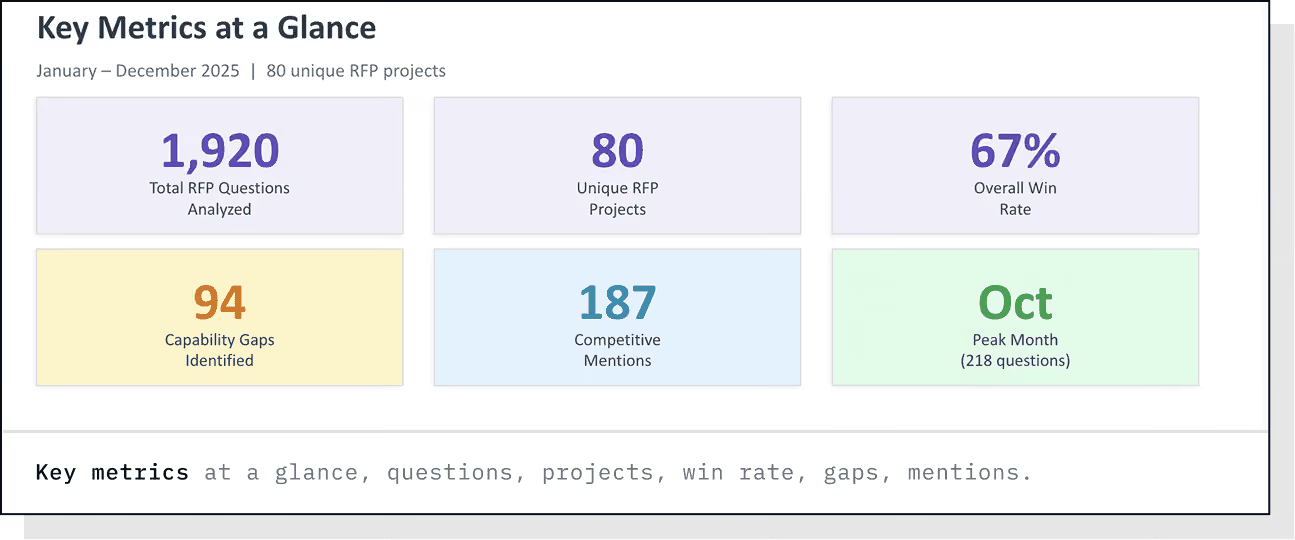
Key metrics at a glance
Every RFP, rolled up.
Questions answered, projects run, win rate, capability gaps, competitor mentions, the whole portfolio in one view, then drill into any theme, trend, or competitive pattern behind the numbers.
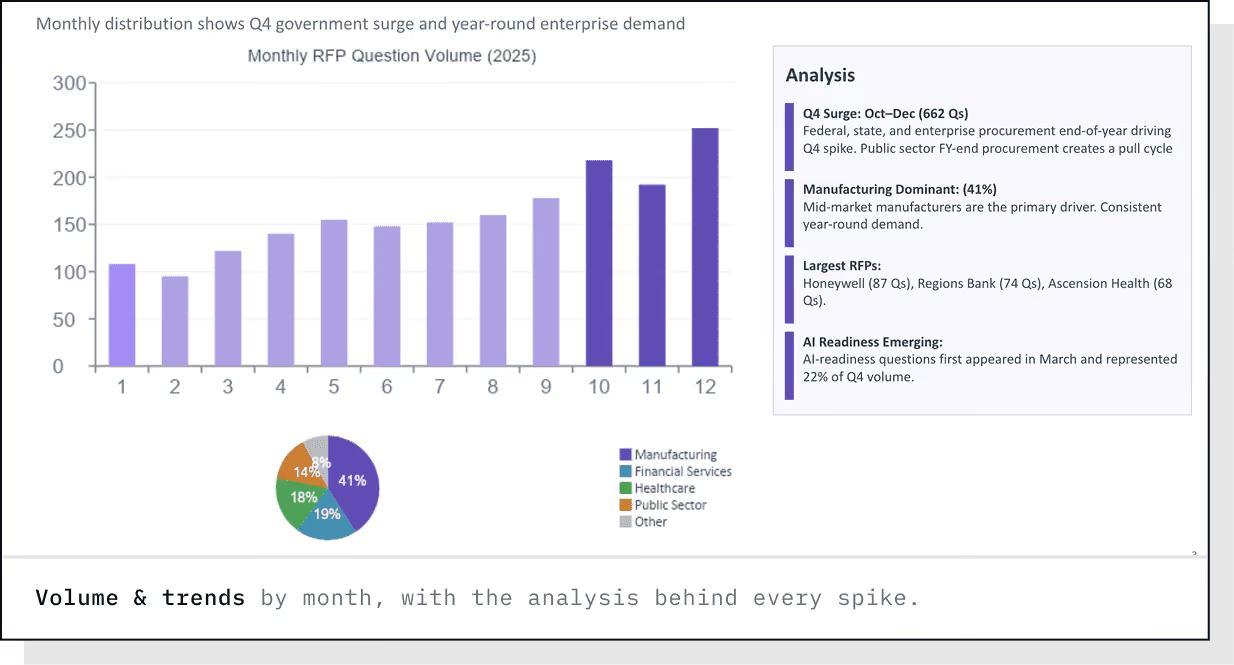
Volume & trends
Mapped by month.
The cyclical nature of RFPs, mapped. Know which months hit hardest so you can staff and plan accordingly, with the analysis behind every spike.
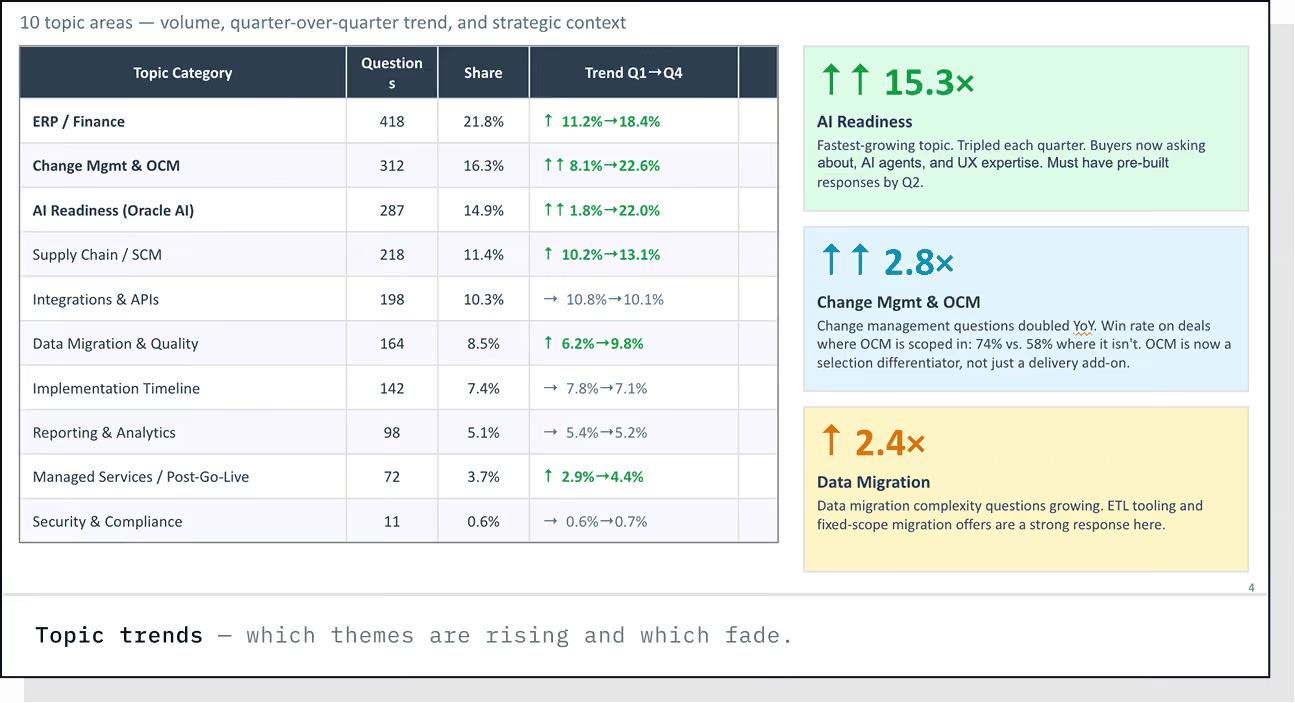
Topic analysis
Themes, rising & fading.
AI readiness vs. supply chain vs. implementation timeline. See which themes are showing up more (AI readiness 15.3×) and which are fading.
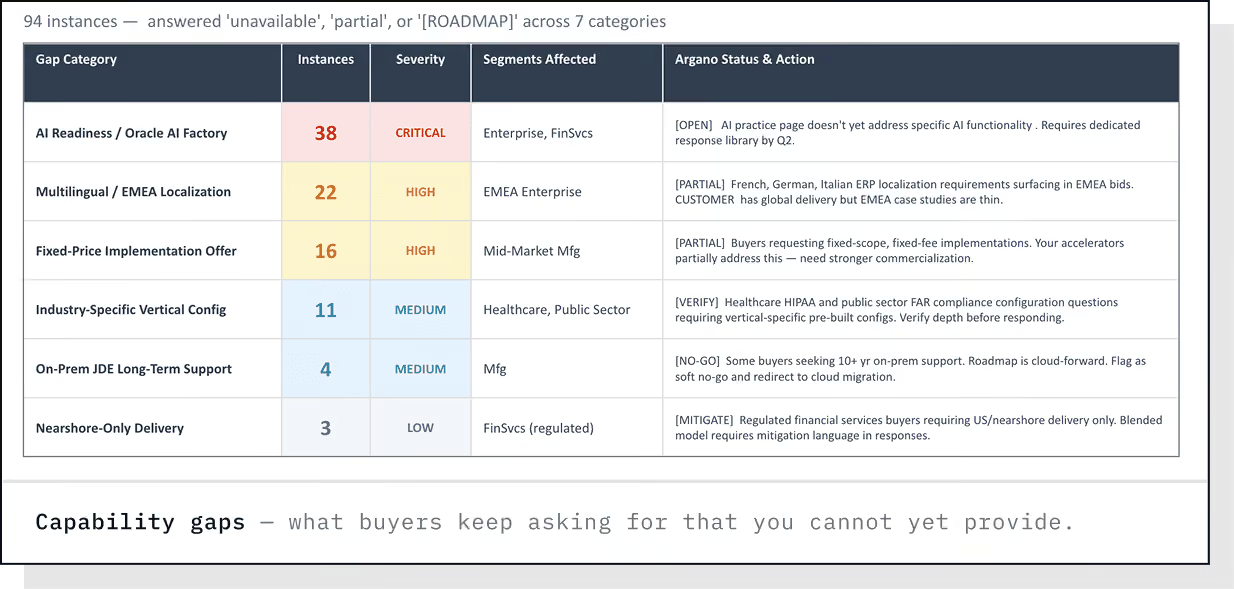
Capability gaps
What you lack today.
The features and answers buyers keep asking for that you cannot yet provide, whether it is killing your no-gos or your win rate.
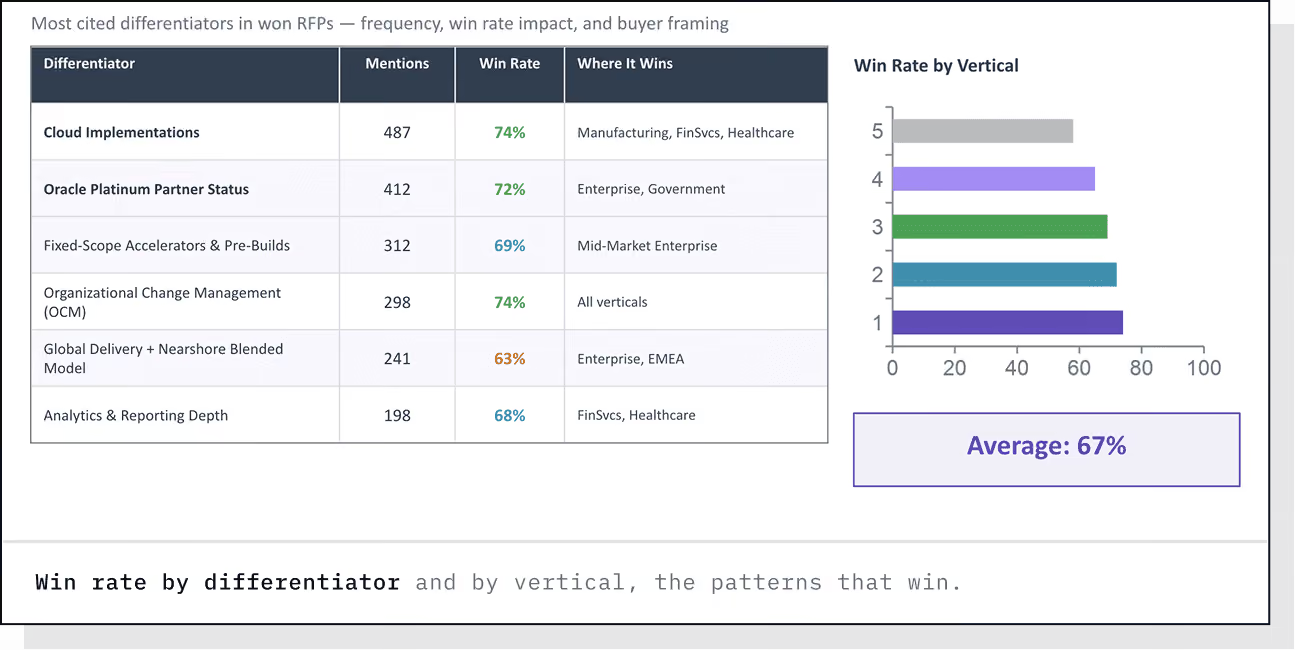
Competitive strengths
The patterns that win.
"74% win rate when cloud implementation is mentioned." "72% when Oracle Platinum Partner status is in the brief." The patterns that win, surfaced by differentiator and by vertical.
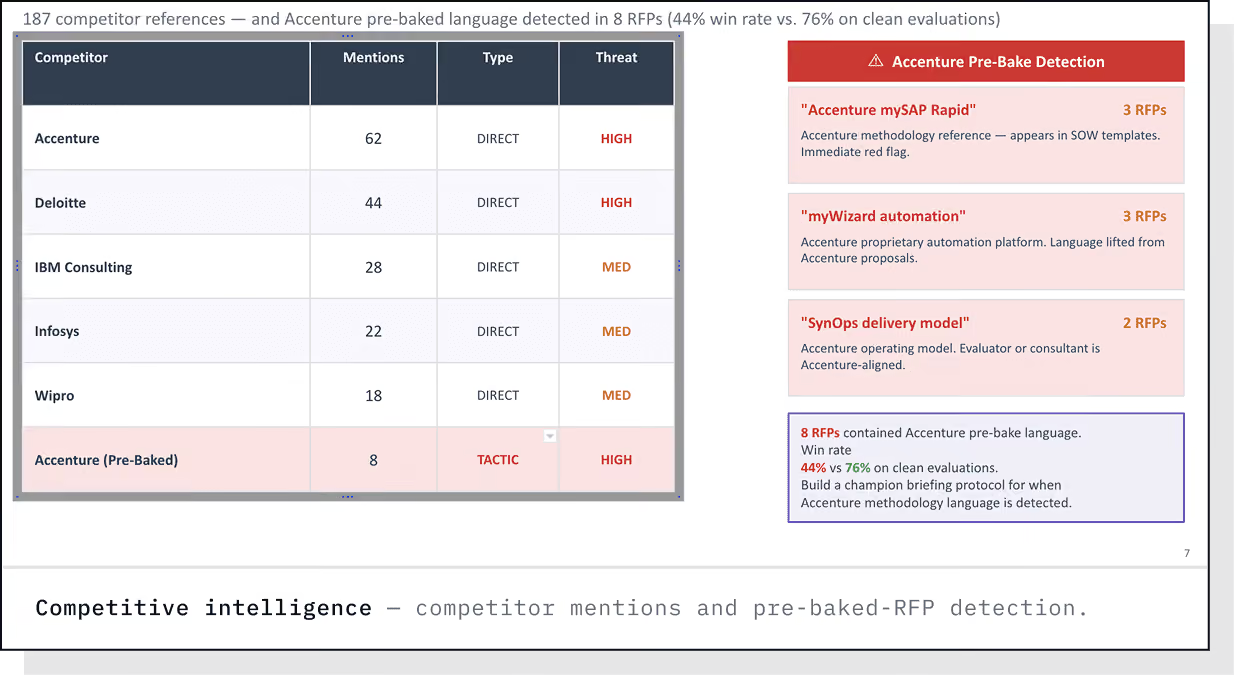
Competitive intelligence
Pre-baked detection.
Every time a named competitor shows up, is it a direct threat, and how high? Detect RFPs that look pre-baked for someone else, so your team stops pouring weekends into them.
Tactical reporting
Project-level numbers.
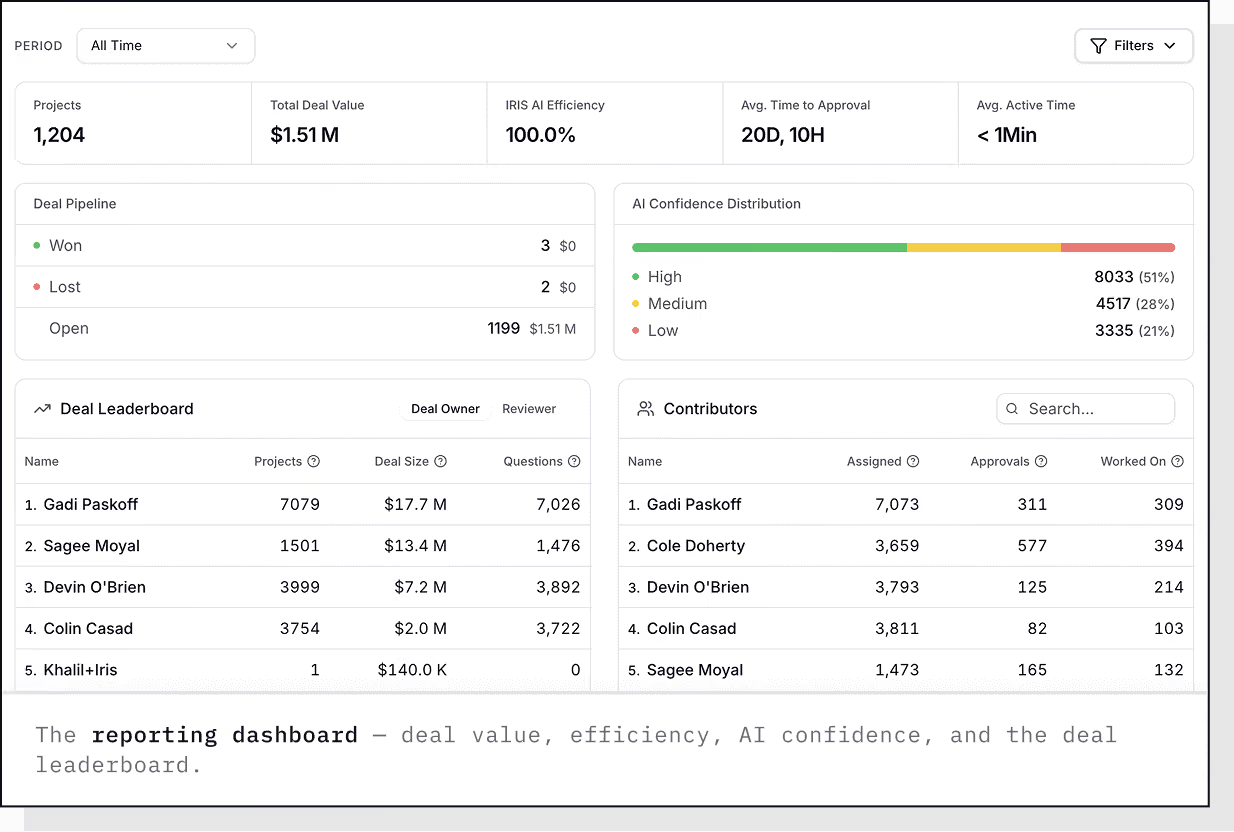
The reporting dashboard
Proof for leadership.
The cycle-time and ROI numbers that prove what your
proposal team is driving:
- Projects in any period — RFPs, DDQs, questionnaires by date, owner, status, approver.
- Deal value impacted — the revenue your team is influencing, not just submitting.
- Efficiency & accuracy — confidence over time, edit volume, how often Iris is right out of the box.
- Time to approval — average time to approval, and average turnaround per RFP.
- Deal leaderboard — who is running, editing, and approving the most.
Obligations · every commitment made in writing
Every promise,
tracked.
Captured the moment it is written
A to-do list, not a liability.
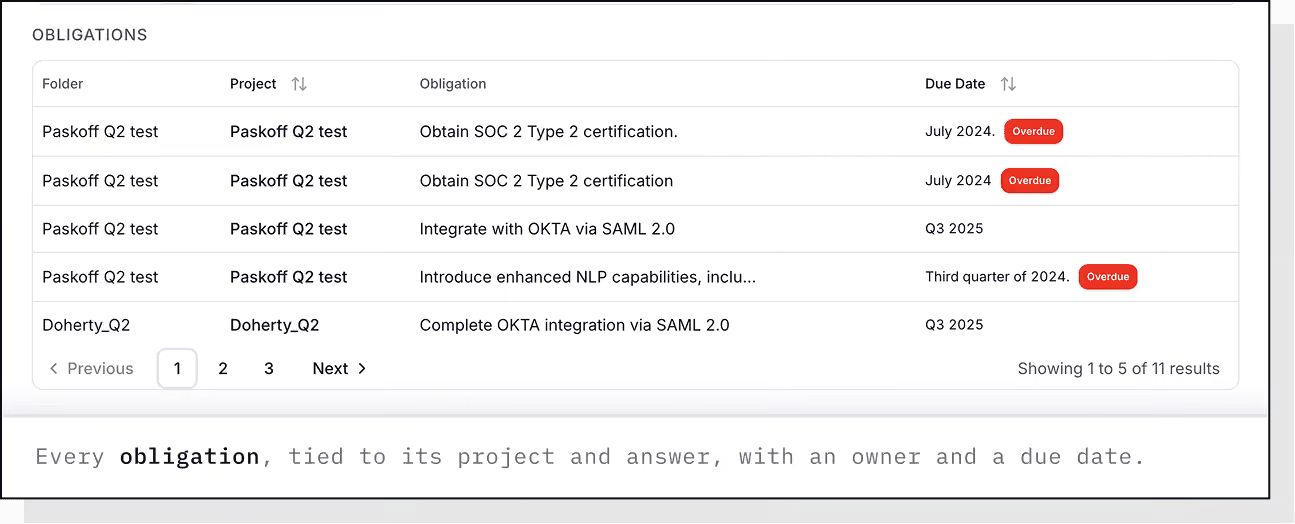
RFPs ask for the moon, "SOC 2 in 3 months," "integration by Q3," "local data residency within a year." Deals close 6–12 months later, and Iris tracks every promise so you can hold yourself to them without re-reading the proposal.
Each obligation is tied back to its project and the exact answer it came from, with a due date and an owner. Filter by open, overdue, and upcoming.
Strategic initiatives · recommendations
So what
should we do about it?
Recommendations, not just
charts
A prioritized action plan.
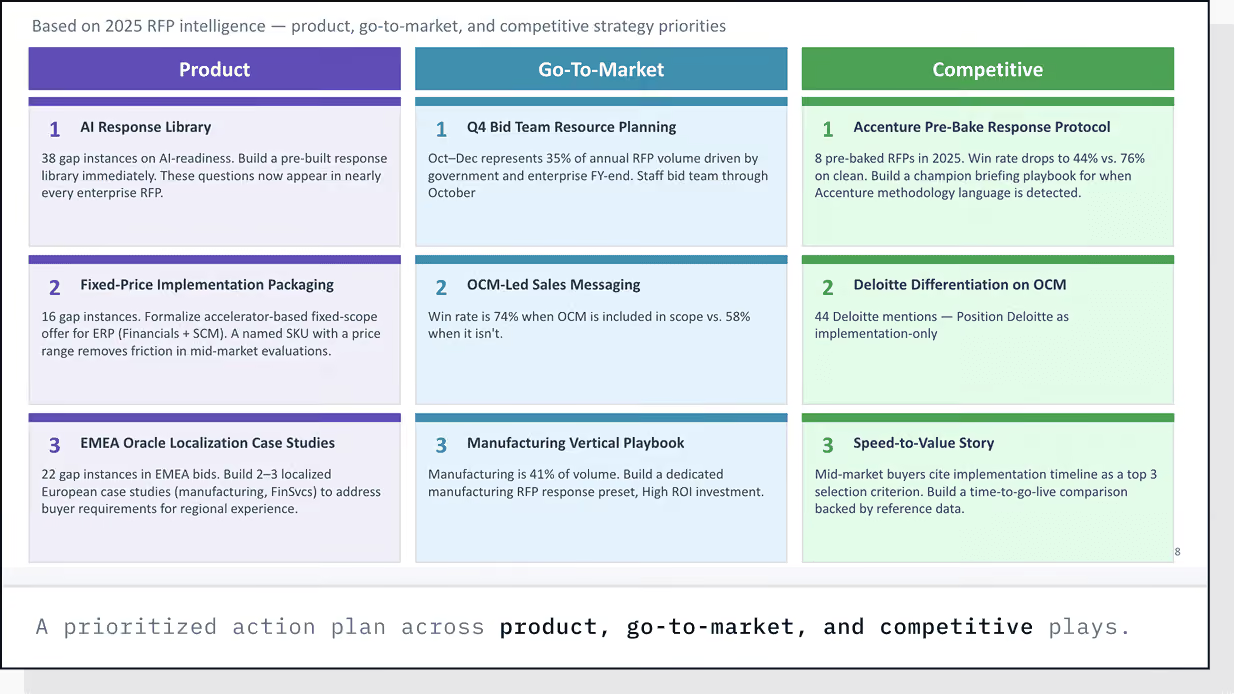
Iris turns everything it sees across your responses into a prioritized action plan, the product gaps to close, the go- to-market moves to make, and the competitive plays to run. A clear answer to "so what should we do about it?"
See it live
Running on
real data.
15 minutes. We'll show it running on real customer data, win themes, capability gaps, obligations, and the initiatives that follow.