How to Build a Weighted Scoring Model for RFPs
March 4, 2025
By
Evie Secilmis


We've all seen it happen: a team member gets excited about a big-name client, and suddenly, everyone is chasing a deal that doesn't align with your company's strengths. Personal bias can easily derail a sales strategy. To make smarter, more objective decisions, you need a weighted scoring system. This method forces you to define your ideal opportunity with clear, agreed-upon metrics, moving past emotion to focus on strategic fit. In this post, we'll break down how to build a scoring model that standardizes your evaluation process and points your team toward consistently winnable bids.
What Is a Weighted Scoring System?
When you're facing multiple opportunities, how do you decide which one to pursue? Whether it's choosing the right RFP to bid on or prioritizing features for a product update, making the right call can feel overwhelming. A weighted scoring system brings structure and objectivity to these tough decisions. It's a straightforward method for evaluating a set of options against a list of important criteria. Think of it as a scorecard that not only tracks points but also gives more value to the points that matter most to your team and your business goals. This approach helps you move past gut feelings and focus on the opportunities with the highest potential for success.
The Basic Definition: A Fair and Objective Decision-Making Tool
At its core, a weighted scoring model is a decision-making tool that helps you prioritize choices by assigning a numerical value to them. According to Product School, "A Weighted Scoring Model is a tool that helps teams decide what to work on first. It does this by giving a number score to each choice based on a set of rules (called 'criteria'). Each rule is given a 'weight' to show how important it is." For example, when evaluating an RFP, your criteria might include project budget, alignment with your company's expertise, and the potential for a long-term partnership. By weighting "alignment with expertise" higher than "project budget," you ensure you're prioritizing bids that you're most likely to win and execute successfully.
Weighted vs. Unweighted Models Explained
The key difference lies in how you value your criteria. In an unweighted model, every criterion is treated as equally important. If you have five criteria, each one accounts for 20% of the final score. This can be useful for quick, low-stakes decisions. However, a weighted model acknowledges that some factors are more critical than others. As the team at Userpilot explains, "In an unweighted model, all rules are equally important. In a weighted model, some rules are more important than others and get a higher 'weight.'" For a sales team, the strategic value of a potential client might be far more important than the initial deal size, so you would assign it a heavier weight to reflect that priority in your decision-making process.
Where It Comes From: A Brief History
This method isn't just a modern business trend; it has deep roots in a field of study called "Multiple Criteria Decision-Making." This discipline focuses on solving complex problems that involve multiple, often competing, objectives. The weighted scoring model is a practical application of these academic principles, designed to make them accessible for everyday business challenges. One of the foundational mathematical models was introduced by a researcher named Stanley Zionts back in 1979, giving this approach a long history of proven effectiveness. It's a time-tested framework that has been refined over decades to help teams make smarter, more data-informed choices when the stakes are high.
Broader Applications Beyond RFPs
While weighted scoring is incredibly useful for evaluating RFPs, its applications extend far beyond the sales cycle. Any department facing complex decisions can benefit from this structured approach. Product development teams, for instance, use it to prioritize which new features to build next. As ProductPlan points out, "Weighted scoring helps everyone on the team, from developers to leaders, see how their daily work connects to the bigger goals of the product." This alignment is powerful. It transforms abstract company objectives into a clear, actionable roadmap that every team member can understand and contribute to, ensuring that daily efforts are always directed toward the most impactful outcomes.
The Benefits and Drawbacks of Weighted Scoring
Like any tool, a weighted scoring model is most effective when you understand both its strengths and its limitations. When used correctly, it can bring incredible clarity and alignment to your team's decision-making process. It provides a structured framework that helps you systematically evaluate your options, making it easier to justify your choices to stakeholders and get everyone on the same page. However, it's not a magic wand. The model is only as good as the criteria you define and the data you use. Let's look at the key benefits you can expect and some potential pitfalls to watch out for as you implement this system.
Why Teams Use This Model (The Benefits)
The primary reason teams adopt weighted scoring is to make their decision-making process more rational and less emotional. It forces you to define what "success" looks like before you even start evaluating your options. This clarity is invaluable, especially when you have multiple stakeholders with different opinions. According to Product School, "It helps make decisions clear, fair, and based on facts, not just feelings." When you're deciding which high-value sales opportunity to dedicate your limited resources to, having a clear, fact-based system ensures you're making a strategic investment of your team's time and effort, rather than just chasing the shiniest object.
Reduces Personal Bias for More Objective Decisions
We all have biases that can unconsciously influence our choices. A weighted scoring model acts as a check against that, pushing for objectivity. By forcing the team to agree on a set of criteria and weights ahead of time, you create a standardized evaluation process. This system "uses numbers to make choices, which is more objective than just opinions." Instead of relying on one person's gut feeling about a potential deal, the entire team evaluates each opportunity against the same consistent framework. This leads to more defensible decisions that are grounded in shared strategic priorities rather than individual preferences.
Creates Transparency and Explains Priorities
Have you ever wondered why a certain project was prioritized over another? A weighted scoring model removes that mystery. The process is inherently transparent, as "everyone can see how decisions were made, what rules were used, and how each option was judged." This visibility is crucial for building trust and alignment within a team. When people understand the "why" behind a decision, they are more likely to support it, even if it wasn't their first choice. This open approach fosters a culture of clear communication and shared understanding, ensuring everyone is working toward the same goals.
Improves Teamwork and Alignment
The process of building a weighted scoring model is a powerful team-building exercise in itself. It requires collaboration from different departments and stakeholders to define the criteria and assign the weights. This collaborative effort ensures that diverse perspectives are considered, leading to a more robust and well-rounded decision-making framework. As Userpilot notes, "When different teams help choose the rules and their importance, everyone better understands the product's goals." This shared understanding is critical for aligning the entire organization, from sales and marketing to product and support, around a unified vision of what matters most.
Potential Downsides to Keep in Mind (The Drawbacks)
While weighted scoring offers a lot of benefits, it's important to be aware of its potential downsides. The model can sometimes create a false sense of scientific certainty, and if you're not careful, it can be just as susceptible to bias as any other method. The key is to treat it as a guide that informs your judgment, not as a rigid rule that replaces it. Being mindful of these potential drawbacks will help you use the tool more effectively and avoid common mistakes that can undermine its value.
Subjectivity in Scores and Weights
The biggest challenge with weighted scoring is that it doesn't completely eliminate subjectivity—it just moves it to an earlier stage in the process. The act of choosing criteria and assigning weights is inherently subjective. It can be difficult "to give exact scores to features or tasks without some personal opinion." To mitigate this, it's essential to involve a diverse group of stakeholders in creating the model. By discussing and debating the criteria and weights as a team, you can arrive at a consensus that reflects the collective priorities of the organization, making the process as objective as possible.
The Risk of Oversimplifying Complex Issues
Sometimes, a number can't tell the whole story. A weighted scoring model "might make complex decisions too simple by turning everything into numbers." For example, a potential client might have a lower score based on your criteria, but the strategic value of entering a new market with them could be immense. These qualitative, long-term factors are difficult to capture in a simple score. It's important to remember that the final score is a data point, not the final decision. Use it to guide your conversation, but don't be afraid to override it when your strategic judgment tells you there's more to the story.
Time-Consuming Setup Process
Creating a thoughtful and effective weighted scoring model takes time. You need to gather stakeholders, facilitate discussions, and come to an agreement on what's most important. "Defining all the rules and weights can take a while, especially for small teams." This initial time investment can feel like a hurdle, but it's crucial for the model's success. Rushing the setup process can lead to a flawed framework that doesn't accurately reflect your priorities. It's better to invest the time upfront to build a solid foundation for your future decisions.
Relies on High-Quality, Accurate Information
A weighted scoring model is completely dependent on the quality of the information you feed into it. As the saying goes, "garbage in, garbage out." If "the data you use to score things is wrong or old, the model will give bad results." This is especially true when responding to RFPs, where your ability to win is based on providing accurate, compelling, and up-to-date information. Using an AI-powered platform like Iris ensures your team is always working from a single source of truth. By keeping your content library current and accurate, you can confidently score opportunities and generate high-quality proposals that give you the best chance to win.
How to Build a Winning RFP Scoring System
When evaluating RFP software opportunities, the difference between winning and wasting resources often comes down to one thing: your scoring system. Without a structured framework, AEs, Capture Managers, Pre-Sales, and the C-Suite spend countless hours debating bid viability instead of focusing on real opportunities.
A strong RFP scoring system enables your team to qualify and prioritize bids in seconds, not days—saving thousands of hours per year. Here's how to build one that works.
First, What Are Your RFP Scoring Criteria?
Every RFP platform has different requirements, but the fundamental question remains: Should we pursue this bid? Establishing clear criteria ensures every RFP is measured against the same standard.
🔹 Strategic Fit – Does this align with company goals?
🔹 Customer Relationship – Do we have an existing relationship or a path to influence?
🔹 Competitive Position – Who else is bidding, and can we win?
🔹 Solution Fit – Do we meet the technical and security requirements?
🔹 Revenue Potential – Is the deal size worth the effort?
🔹 Resource Availability – Can we deliver without stretching the team too thin?
Assigning weights to these criteria prevents internal debates and ensures alignment between sales, leadership, and delivery teams.
Using Frameworks (RICE, ICE) to Choose Criteria
You don't have to create your scoring criteria from scratch. Product management teams have used prioritization frameworks for years, and we can borrow their best ideas. Models like RICE (Reach, Impact, Confidence, Effort) and ICE (Impact, Confidence, Ease) provide a fantastic starting point for evaluating opportunities. While designed for features, the logic translates perfectly to RFPs. These frameworks give you a structured way to think about which factors are most important for your business when deciding whether to pursue a bid.
Adapting a framework like RICE helps your team make informed prioritization decisions by breaking down an opportunity into clear components. For an RFP, "Reach" could be the client's size, "Impact" the potential revenue, "Confidence" your belief in winning, and "Effort" the resources required. Using a consistent set of rules makes it easy to compare bids objectively and helps everyone on the team see how their work connects to the company's larger goals.
Next, Create Your Weighted Scoring Model
Instead of a yes/no decision process, use a weighted scoring model to quantify bid viability.
📌 Example:
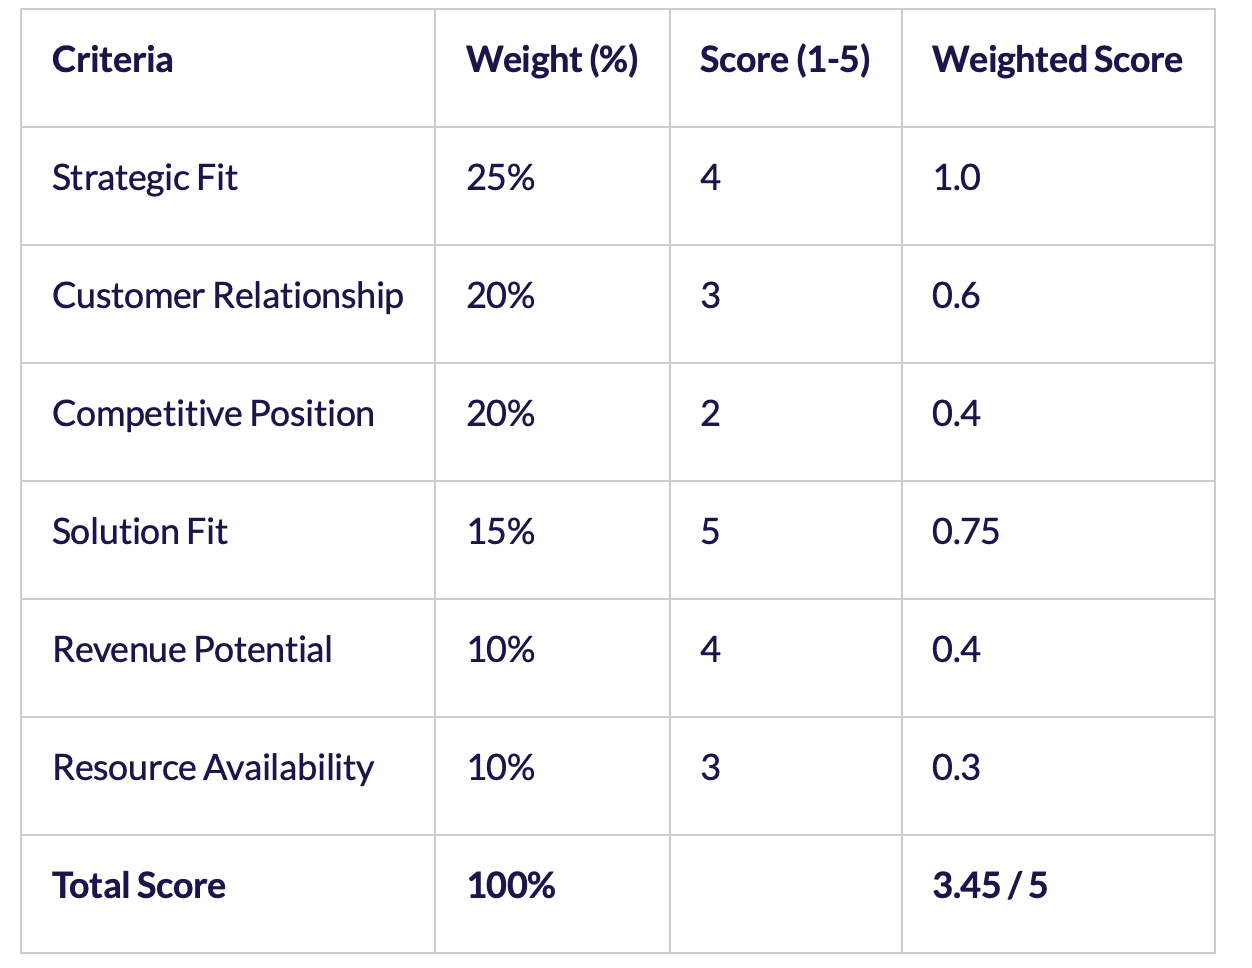
Set a threshold—for example, only pursue bids with a score of 3.5+. If a bid falls below, it's a no-go unless leadership overrides.
The Step-by-Step Calculation Process
Once you have your criteria and weights, the math is pretty straightforward. You don't need a data scientist to figure it out—a simple spreadsheet will do the trick. This process turns subjective feelings about an RFP into a concrete number that guides your decision. It's a fair and repeatable way to evaluate every opportunity that comes across your desk. Here's how you can calculate the score for each bid, step by step.
- Define What Matters: First, confirm the criteria you'll use to judge each opportunity. These are the factors we discussed earlier, like strategic fit, revenue potential, and your competitive position.
- Assign Importance (Weights): Give each criterion a weight to reflect its importance. For example, "Revenue Potential" might be weighted at 30%, while "Existing Relationship" is only 10%. Make sure all your weights add up to 100%.
- Score Each Option: Go through your list of criteria for the specific RFP and rate how well it performs on a simple scale, like 1 to 5. A score of 1 means it's a poor fit for that criterion, while a 5 means it's a perfect match.
- Calculate the Total Score: For each criterion, multiply its score by its weight to get a weighted score. Finally, add up all the weighted scores to get the final number for that RFP.
An Alternative Calculation Method
You might wonder if you really need to assign weights. The alternative is an unweighted model, where every criterion is treated as equally important. In this method, you'd simply score each factor and add up the points. However, for complex decisions like a go/no-go on an RFP, this approach can be misleading. Is your relationship with the customer truly as important as your ability to meet the technical requirements? Probably not. A weighted model is more nuanced because it reflects the reality that some factors matter more than others, giving you a more accurate picture of the opportunity.
After Scoring: How to Interpret and Act on Results
Getting a final score is a great first step, but the number itself doesn't close the deal. The real value of a weighted scoring system is how it facilitates a strategic conversation. It moves your team away from debating opinions and toward making data-informed decisions. The score isn't a verdict; it's a guide. It helps you quickly identify the most promising bids and provides a clear, objective reason for passing on the ones that aren't a good fit. Now, your team can focus its energy on how to win the best opportunities instead of arguing about which ones to pursue.
Grouping Scores into Tiers for Prioritization
To make your scoring system even more actionable, group the scores into simple tiers. This immediately tells your team what to do next without having to analyze the specific number. Bids with the highest scores are your top priorities and should be pursued aggressively. You can create a simple traffic-light system to make it clear for everyone involved. For example, a score of 4.0 or higher is a "Green Light," meaning you should move forward immediately. A score between 3.0 and 3.9 could be a "Yellow Light," requiring a discussion with leadership before proceeding. Anything below 3.0 is a "Red Light"—a clear no-go, saving your team from wasting valuable time and resources.
The Importance of Validating Top-Scoring Ideas
Even with a high score, it's crucial to do a final sanity check. Before dedicating resources to a full proposal, bring the team together to discuss the results. The goal is to achieve team consensus on the criteria, weights, and final score. Does the high score feel right? Are there any risks or dependencies the model might have missed? This conversation ensures everyone is aligned and committed to the pursuit. Having a central knowledge library with up-to-date information is key here, as it ensures your scores are based on accurate data. When your entire team trusts the information, you can confidently stand behind your decision to move forward and focus all your energy on winning.
Speed Things Up: Automate RFP Scoring with AI
Manually applying a scoring model for every bid is slow and inefficient. AI-driven RFP response tools like Iris AI automate this process:
✅ Extracts key bid requirements in seconds
✅ Applies your custom scoring framework instantly
✅ Generates an AI-powered bid/no-bid recommendation
✅ Integrates with security questionnaire automation for compliance checks
Rather than waiting for multiple stakeholder reviews, your team can get a preliminary score in 30 seconds, then refine as needed.
Keep It Consistent: Standardize and Improve Your System
Once an RFP scoring system is in place, refine it over time:
📊 Track historical win rates – Does high scoring correlate with wins?
📉 Identify low-value pursuits – If most low-scoring bids result in losses, reinforce the cutoff.
🔄 Adjust weights as needed – If security questionnaire response automation factors heavily into past losses, increase its importance.
The goal is to build a repeatable process that removes guesswork and lets sales teams focus on winnable deals.
Gaining Team Consensus on Criteria and Weights
Building your scoring model isn't a solo mission. To make it stick, you need buy-in from every team that touches the RFP process—sales, leadership, product, and delivery. The best way to do this is to get everyone in a room (virtual or physical) to define the criteria and agree on the weights together. This collaborative effort does more than just create a spreadsheet; it builds a shared understanding of what an ideal opportunity looks like. Assigning weights to these criteria is crucial because it prevents internal debates and ensures alignment between sales, leadership, and delivery teams. When everyone helps build the system, they're far more likely to trust and use it, leading to faster, more confident decisions.
How Company Size Affects Implementation
The way you implement a weighted scoring system often depends on the size of your team. For startups and small businesses, the process is typically more agile. You can gather key stakeholders quickly, but the setup can still feel time-consuming for a lean team. The main benefit here is focus; a scoring model ensures every pursuit directly supports the company's overall vision and helps teams prioritize what truly matters when resources are limited. For larger enterprises, the challenge is less about time and more about managing complexity and scale. Gaining consensus across multiple departments requires a more structured approach. The system provides much-needed clarity, but it's important not to rely solely on the numbers. The model should guide decisions, not dictate them, leaving room for strategic judgment on major deals.
Score Bids in Seconds with Iris AI
With Iris AI, you can move from RFP chaos to clarity in under a minute.
🔹 Sign up at app.heyiris.ai (5 free credits + 3 per referral)
🔹 Test AI-driven scoring for real RFPs
🔹 Automate qualification and optimize bid strategy
The fastest way to stop wasting time on the wrong RFPs? Let AI do the first pass.
Frequently Asked Questions
This sounds like a lot of setup. Is it really worth the effort? I get it—adding another process can feel like a burden, especially when your team is already stretched thin. But think of the time you'll save in the long run. That initial investment in building your scoring model pays off by eliminating lengthy debates over every single RFP. Instead of wasting hours in meetings trying to decide if a bid is viable, you get a clear, data-backed answer in minutes. This frees your team to focus their energy on crafting winning proposals for the opportunities that truly matter.
What if my team disagrees on the criteria or weights? Disagreement is actually a healthy part of this process! It means your team is engaged and thinking critically about what a "good" opportunity looks like. The key is to treat the setup as a collaborative workshop, not a top-down directive. Get everyone who touches the RFP process in a room and facilitate a discussion. The goal isn't to find a perfect system on day one, but to reach a consensus that everyone can stand behind. This shared ownership makes the model much more effective because the team trusts the results.
Can't we just use a simple yes/no checklist? You could, but a simple checklist treats every factor as equally important, which is rarely the case. Is the potential for a long-term partnership really as critical as your ability to meet the core technical requirements? A weighted system adds a layer of nuance that reflects your actual business priorities. By assigning more importance to the criteria that have the biggest impact on your success, you get a much more accurate and realistic picture of an opportunity's true value.
What happens if a really strategic opportunity scores poorly? This is a great question because it highlights a critical point: the scoring model is a guide, not a rigid rule. It's designed to inform your judgment, not replace it. If an RFP scores below your threshold but your gut tells you there's a compelling strategic reason to pursue it—like entering a new market or partnering with a dream client—you should absolutely discuss it. The score provides an objective starting point for that conversation, forcing the team to articulate exactly why this particular opportunity is worth the exception.
How often should we review and update our scoring model? Your scoring model shouldn't be set in stone. Your company's goals and market conditions will change, and your model should evolve with them. I recommend reviewing it with your team every six months or at the end of every quarter. Look at your win-loss data. Are your high-scoring bids consistently turning into wins? Are there criteria you initially thought were important that haven't panned out? A regular check-in ensures your system stays relevant and continues to point you toward the best opportunities.
Key Takeaways
- Standardize your bid evaluation process: Move beyond subjective gut feelings by creating a scoring system with clear, agreed-upon criteria. This ensures every opportunity is measured against the same strategic goals, leading to more objective and defensible decisions.
- Define your criteria as a team: Your scoring model is only as strong as the buy-in it receives. Involve sales, leadership, and delivery teams in defining criteria and assigning weights to build a shared understanding of what an ideal opportunity looks like for your business.
- Use scores to start a conversation, not end one: A final score isn't a rigid command; it's a data point to guide your strategy. Group bids into tiers (like pursue, discuss, or pass) to quickly prioritize your efforts and focus team discussions on the highest-potential deals.
Related Articles
Share this post
Link copied!


_EasiestToDoBusinessWith_EaseOfDoingBusinessWith.svg)
_HighPerformer_HighPerformer.svg)


_BestSupport_QualityOfSupport.svg)